◀ Back to projects overview P201406_001_DEL
Meteo Dashboard Validation Phase
Public summary
Weather conditions at offshore wind farm sites heavily determine the business case of offshore wind. Wind, waves and currents have a profound impact on i) project development and financing (wind resource and wake assessments), ii) project engineering (wind farm layout, foundation design, and wind turbine design) and iii) project construction, operation and maintenance and decommissioning. Reliable on-site data and intelligent processing of this data for decision making creates additional value (including higher yield and lower risks) and reduces the cost of offshore wind (improved maintenance strategies) for offshore project owners and operators. Such aspects are increasingly important as offshore wind projects increase in size and distance to shore. Gathering, processing, storing and presenting this reliable on-site data is currently not considered in wind farms while the historical, actual as well as forecasted site condition data can clearly improve the efficiency of operational wind farms and wind farms under development. Improvements can be found in better planned offshore activities, better insight in aging processes of components of the wind farm, leading to improved planning of maintenance activities and better designed structures. Additionally, optimised wind farm layouts are the result due to better insight in loads and wake fields.
Project objective
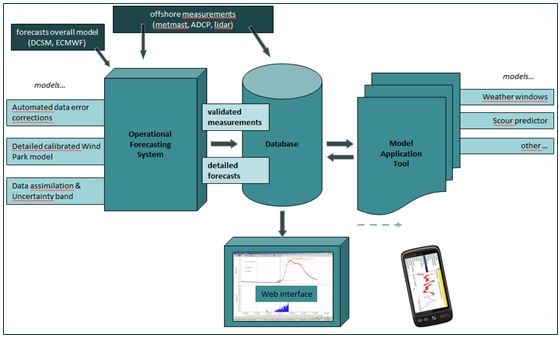
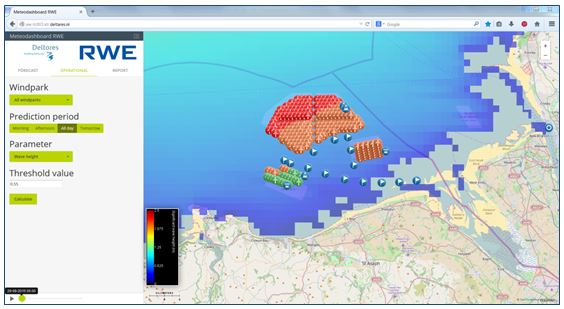
The objective of this project was to further optimise the existing Meteo Dashboard - initially set up under the preceding FLOW project- which is an integrated software system that collects, stores, computes and presents measured and forecasted meteo- and hydrodynamic data for decision making of maintenance activities in an offshore wind farm. For this project Meteo Dashboard is specifically set up for the Irish Sea, where three wind farms of RWE are located, called Rhyl flats, North Hoyle and Gwynt y Môr of which the latter just became fully operational in June 2015. The Meteo Dashboard can be applied to other offshore wind farms, with relatively small effort. The gathered data can be used for the optimisation of existing and future offshore wind farms.
Project results
Based on the initial Meteo Dashboard project and following RWE’s requirements the system was further optimised for the considered offshore wind farms in the Irish Sea by Deltares. RWE has currently installed several measurement instruments at the wind farms including an additional AWAC specifically under this project, resulting in a unique amount of validation data for Meteo Dashboard. Partly based on this data, techniques have been developed and implemented with respect to the forecast of significant wave height by means of error correction. This resulted in a significant improvement of the forecast capability in comparison to conventional forecasting systems. After the development phase the system was used for the remaining operational period of 2015. Together with weather forecasts, the measured data and forecasts of waves and currents is made presentable via a user interface for operators to support the O&M planning.
Project contribution to cost and risk reduction of far-offshore wind energy
The arguments for the Meteo Dashboard project resulting in cost and risk reduction of (far-) offshore wind energy is as following:
- The use of a simple Operation and Maintenance decision making tool with more accurate forecast information optimises O&M planning, results in fewer cancelled trips when personnel and vessels are already offshore;
- Increases effective working time of O&M activities, with the development of knowledge rules for when (under which weather conditions) maintenance actions are carried out;
- Improve yield: due to more accurate forecast, early weather windows can be identified, subsequently WTG’s is repaired faster;
- Modelling the hydrodynamic and wave conditions at each wind turbine during the whole life time of the offshore wind farm will increase knowledge of the foundation and WTG loading;
- Delivering data and thus knowledge of metocean conditions at all WTG locations is expected to result in increased certainty of loadings at specific WTGs, for better consideration of which turbine will require preventive maintenance;
- Possibly the scour protection inspection regime could be adjusted according to conditions which have occurred at the site;
- Possible extension of the life time of the offshore wind turbines, after structural integrity analyses based on the conditions which have actually occurred at the site.
- Based on more accurate forecast, wind turbines can be switched to idle mode when unwanted combination of specific loadings is expected (for instance, extreme wind and wave conditions misaligned).
- HSSE - As additional benefit, the improved knowledge of site conditions and vessel accessibility resulting from Meteo Dashboard will lead to safer working conditions for the O&M technicians. This is an important benefit, but cannot be quantified in terms of costs.
Conclusions
It is concluded that Meteo Dashboard will be a blue print for future projects and is upgraded during this project from Technology Readiness Level (TRL) 5 to ~8. Furthermore, the generated data is expected to improve the operation of RWE’s offshore wind farms and the development of new wind farms. The Meteo Dashboard in its current form and status, is estimated to lead to a cost reduction (LCoE) of approximately 0.5~1.0%. Note that not all qualitative arguments as mentioned above could be quantified in the FLOW Offshore Wind Cost model. Therefore, the cost reduction capacity of Meteo Dashboard could be even more significant in the end. Furthermore, the generated data by Meteo Dashboard will support R&D in offshore wind in the near future.
Contact details
Mr. Jan-Joost Schouten
 Share this page
